

If GolinksPRO Download Manager closes unexpectedly or stops responding, a crash report window opens. It shows what happened, lets you read the whole report, and can send it to the developers on GitHub. Each report helps fix the problem for everyone.
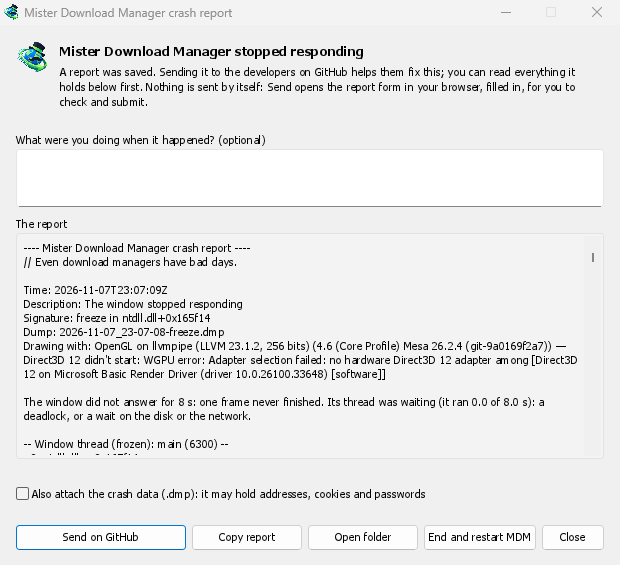
表示される内容
- GolinksPRO Download Manager closed unexpectedly: GDM crashed, or hit an internal error and closed.
- GolinksPRO Download Manager stopped responding: its window didn't answer for 8 seconds. GDM is still running, frozen. End and restart GDM closes the frozen copy and starts a new one. If GDM answers again by itself, the window says so.
ウィンドウ内:
- 発生時に何をしていたか? はオプションです。「URL を追加を開いた」など、数語で構いません。
- レポート には、送信されるすべての内容が表示されます。必要であれば、まずお読みください。
- GitHub で送信 をクリックすると、GitHub の クラッシュレポート フォームがブラウザで開き、レポートが保存されているフォルダとともに、すでに記入されています。レポートファイルをフォームにドラッグし、確認して送信してください。GitHub アカウントが必要です。何も自動的に送信されることはありません。
- 誰かがすでに同じ問題を報告している場合、ウィンドウにその旨が表示されます(すでにイシュー #… として報告されています)。報告されたイシューを開く をクリックすると、それが開き、レポートがクリップボードにコピーされるので、コメントとして追加できます。
The other buttons copy the report, open its folder, or start GDM again.
レポートに含まれる内容
- What happened: the error and the place in GDM's code where it happened.
- The stack: the place in GDM's code where it crashed or froze, and what every other part of it was doing.
- GDM's recent log: for example "command AddUrl" or "window opened: add-url".
- The system: GDM's version and how you installed it, your operating system and its version, the processor, the language and theme, and how many downloads and queues you have. These are counts only.
以下の内容は含まれません:
- ダウンロードアドレスまたはファイル名。
- フォルダパスでは
~と表示されるユーザー名。
エラーメッセージに、入力した内容が引用されている場合、そのテキストはレポートに含まれるため、送信する前に読んでください。
The crash data file (.dmp) is a snapshot of what GDM was running at that moment. It helps the developers most, but it can hold pieces of what GDM had in memory, such as download addresses, cookies and saved passwords. It is only attached when you tick Also attach the crash data.
レポートの保存場所
In GDM's data folder:
crashes\: 各レポート (.txt) とそのクラッシュデータ (.dmp);logs\: GDM's log (mdm.log, with older ones asmdm.1.logand so on, 2 MB each).
GDM's data folder is %APPDATA%\misterdownloadmanager on Windows, ~/Library/Application Support/misterdownloadmanager on macOS, and ~/.local/share/misterdownloadmanager on Linux. In portable mode it is the data folder next to the program.
The log records what GDM does, so a report can show what led to a problem. To log more detail, start GDM with the environment variable MDM_LOG=debug.
開発者向け
How it works: a second copy of GDM, the monitor, starts beside it with --crash-monitor. The crash code lives in crates/crash and crates/app/src/crash.rs.
- Catching problems. When GDM crashes (a Windows exception, a signal on Linux, a Mach exception on macOS), panics, or freezes, it asks the monitor for a dump. A freeze is a frame of the window running more than 8 s, seen by a watchdog thread that ignores time spent asleep. It times both parts of a frame: what GDM handles (the commands that come in, the clock of downloads, queues and the Scheduler), which runs minimized too, and the drawing; never the wait between frames. The watchdog also measures how much processor time the window thread got meanwhile, and the report says what that means: it ran all along (a loop), it waited in a lock or on I/O (a deadlock), or it hardly ran in ordinary code, which is a computer too busy to run GDM or slow to load it from disk, most likely not GDM's bug (those share one signature,
freeze while the computer was busy). When the window thread is already back in the event loop by the time the dump is written, the freeze was over before the snapshot, so its stack can't explain it; those reports say so and share the signaturefreeze over before the snapshot. macOS doesn't measure it yet. The monitor then writes a minidump of every thread from outside, throughminidumperandcrash-handler. A crashed process never writes its own dump, which is how Firefox, Crashpad and Sentry do it too. - ダンプの読み取り。 モニターは Mozilla の
rust-minidumpでダンプを読み取ります。リリース版の Breakpad シンボルが見つかった場合は、それを使用します。ソースからビルドした場合は、--features mdm-crash/native-symbolsを使ってビルドされていれば、隣にあるネイティブのデバッグ情報(.pdb、DWARF)も読み取れます。配布版アプリには、この数 MB のリーダーは含まれていません。レポートのシグネチャ(例:freeze in misterdownloadmanager::winui::combo_edit)は、同じ問題のレポート間で変わらず、ウィンドウはそのシグネチャを使って既存の問題を検索します。 - シンボル。 リリースビルドには行テーブル(
debug = "line-tables-only")が含まれますが、デバッグ情報はダウンロードに含まれません。CIはデバッグ情報をMisterDownloadManager-<version>-symbols-<platform>.zip(tools/installer/symbols.py、Mozillaのdump_symsを使用)に変換し、リリース版の他のファイルとともに公開します。スタックにアドレスだけが表示されている場合、レポートウィンドウはそのバージョン用のzipファイルを取得します。 - 問題からの
.dmp:
cargo run -p mdm-crash --bin mdm-symbolicate -- crash.dmp MisterDownloadManager-<version>-symbols-windows-x64.zip
- Testing it.
cargo test -p mdm-crashruns a real freeze, panic and crash (examples/crashy.rs) and checks each report's signature. To try it in the app, start GDM withMDM_CRASH_TEST=1, then runmisterdownloadmanager /show crash-test:freeze(a deadlock; orspin, 12 s of a busy window thread,panic,crash,abort).cargo test -p mdm-app --test freeze_report -- --ignoreddoes that in a copy of the app off the screens, its window visible and minimized.
無料、オープンソース、広告なし、試用期間なし。
Download GolinksPRO Download Manager