

If GolinksPRO Download Manager closes unexpectedly or stops responding, a crash report window opens. It shows what happened, lets you read the whole report, and can send it to the developers on GitHub. Each report helps fix the problem for everyone.
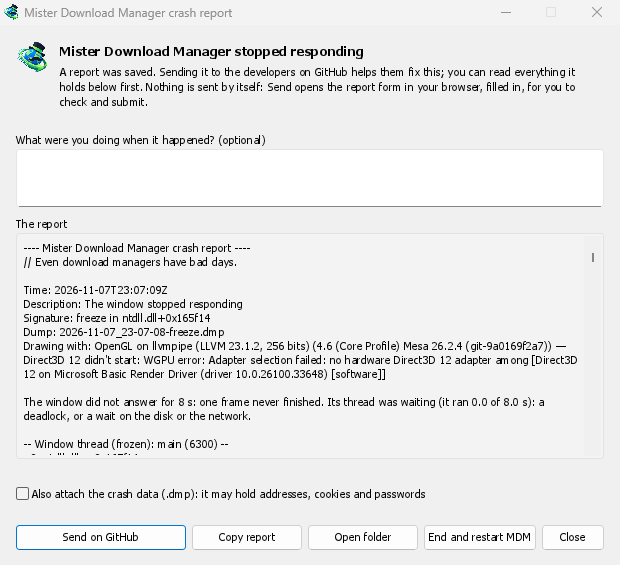
표시되는 내용
- GolinksPRO Download Manager closed unexpectedly: GDM crashed, or hit an internal error and closed.
- GolinksPRO Download Manager stopped responding: its window didn't answer for 8 seconds. GDM is still running, frozen. End and restart GDM closes the frozen copy and starts a new one. If GDM answers again by itself, the window says so.
창에 표시되는 내용:
- 문제가 발생했을 때 무엇을 하고 있었나요?는 선택 사항입니다. "URL 추가를 열었습니다"처럼 몇 마디만 적어도 큰 도움이 됩니다.
- 보고서에는 전송될 내용이 모두 표시됩니다. 원하면 먼저 읽어 보세요.
- GitHub에 보내기를 누르면 보고서가 있는 폴더와 함께 GitHub의 충돌 보고서 양식이 브라우저에서 열립니다. 양식은 미리 작성되어 있습니다. 보고서 파일을 양식으로 끌어다 놓고 내용을 확인한 다음 제출하세요. GitHub 계정이 필요합니다. 자동으로 전송되는 내용은 없습니다.
- 누군가 같은 문제를 이미 보고했다면 창에 해당 내용이 표시됩니다(이미 문제 #…으로 보고됨). 보고된 문제 열기를 누르면 해당 문제가 열리고 보고서가 클립보드에 복사되어 댓글로 추가할 수 있습니다.
The other buttons copy the report, open its folder, or start GDM again.
보고서에 포함된 내용
- What happened: the error and the place in GDM's code where it happened.
- The stack: the place in GDM's code where it crashed or froze, and what every other part of it was doing.
- GDM's recent log: for example "command AddUrl" or "window opened: add-url".
- The system: GDM's version and how you installed it, your operating system and its version, the processor, the language and theme, and how many downloads and queues you have. These are counts only.
다음 내용은 포함되지 않습니다:
- 다운로드 주소 또는 파일 이름;
- 폴더 경로에서
~로 표시되는 사용자 이름.
오류 메시지에 입력한 내용이 인용된 경우, 해당 내용은 보고서에 포함됩니다. 보내기 전에 확인하세요.
The crash data file (.dmp) is a snapshot of what GDM was running at that moment. It helps the developers most, but it can hold pieces of what GDM had in memory, such as download addresses, cookies and saved passwords. It is only attached when you tick Also attach the crash data.
보고서 저장 위치
In GDM's data folder:
crashes\: 각 보고서(.txt)와 충돌 데이터(.dmp);logs\: GDM's log (mdm.log, with older ones asmdm.1.logand so on, 2 MB each).
GDM's data folder is %APPDATA%\misterdownloadmanager on Windows, ~/Library/Application Support/misterdownloadmanager on macOS, and ~/.local/share/misterdownloadmanager on Linux. In portable mode it is the data folder next to the program.
The log records what GDM does, so a report can show what led to a problem. To log more detail, start GDM with the environment variable MDM_LOG=debug.
개발자용
How it works: a second copy of GDM, the monitor, starts beside it with --crash-monitor. The crash code lives in crates/crash and crates/app/src/crash.rs.
- Catching problems. When GDM crashes (a Windows exception, a signal on Linux, a Mach exception on macOS), panics, or freezes, it asks the monitor for a dump. A freeze is a frame of the window running more than 8 s, seen by a watchdog thread that ignores time spent asleep. It times both parts of a frame: what GDM handles (the commands that come in, the clock of downloads, queues and the Scheduler), which runs minimized too, and the drawing; never the wait between frames. The watchdog also measures how much processor time the window thread got meanwhile, and the report says what that means: it ran all along (a loop), it waited in a lock or on I/O (a deadlock), or it hardly ran in ordinary code, which is a computer too busy to run GDM or slow to load it from disk, most likely not GDM's bug (those share one signature,
freeze while the computer was busy). When the window thread is already back in the event loop by the time the dump is written, the freeze was over before the snapshot, so its stack can't explain it; those reports say so and share the signaturefreeze over before the snapshot. macOS doesn't measure it yet. The monitor then writes a minidump of every thread from outside, throughminidumperandcrash-handler. A crashed process never writes its own dump, which is how Firefox, Crashpad and Sentry do it too. - 덤프 읽기. 모니터는 Mozilla의
rust-minidump를 사용해 덤프를 읽습니다. 릴리스의 Breakpad 심볼을 찾으면 이를 사용합니다. 소스에서 빌드한 앱은--features mdm-crash/native-symbols를 사용해 빌드하면 옆에 있는 네이티브 디버그 정보(.pdb, DWARF)도 읽을 수 있습니다. 배포되는 앱에는 수 MB 크기의 이 리더가 포함되지 않습니다. 보고서의 시그니처(예:freeze in misterdownloadmanager::winui::combo_edit)는 같은 문제에 대한 보고서에서 동일하게 유지되며, 창은 해당 시그니처로 기존 이슈를 검색합니다. - 심볼. 릴리스 빌드에는 라인 테이블(
debug = "line-tables-only")이 포함되지만, 디버그 정보는 어떤 다운로드에도 포함되지 않습니다. CI는 이를MisterDownloadManager-<version>-symbols-<platform>.zip(tools/installer/symbols.py, Mozilla의dump_syms사용)로 변환해 릴리스의 다른 파일과 함께 게시합니다. 스택에 주소만 표시되면 보고서 창은 해당 버전의 zip 파일을 가져옵니다. - 문제의
.dmp:
cargo run -p mdm-crash --bin mdm-symbolicate -- crash.dmp MisterDownloadManager-<version>-symbols-windows-x64.zip
- Testing it.
cargo test -p mdm-crashruns a real freeze, panic and crash (examples/crashy.rs) and checks each report's signature. To try it in the app, start GDM withMDM_CRASH_TEST=1, then runmisterdownloadmanager /show crash-test:freeze(a deadlock; orspin, 12 s of a busy window thread,panic,crash,abort).cargo test -p mdm-app --test freeze_report -- --ignoreddoes that in a copy of the app off the screens, its window visible and minimized.
무료, 오픈 소스, 광고 없음, 평가판 없음.
Download GolinksPRO Download Manager