

If GolinksPRO Download Manager closes unexpectedly or stops responding, a crash report window opens. It shows what happened, lets you read the whole report, and can send it to the developers on GitHub. Each report helps fix the problem for everyone.
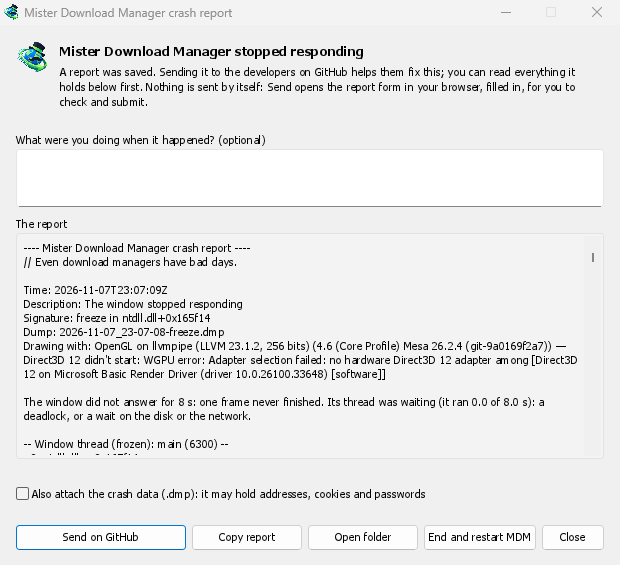
สิ่งที่คุณเห็น
- GolinksPRO Download Manager closed unexpectedly: GDM crashed, or hit an internal error and closed.
- GolinksPRO Download Manager stopped responding: its window didn't answer for 8 seconds. GDM is still running, frozen. End and restart GDM closes the frozen copy and starts a new one. If GDM answers again by itself, the window says so.
ในหน้าต่าง:
- คุณกำลังทำอะไรอยู่เมื่อเกิดเหตุการณ์นี้ขึ้น? เป็นทางเลือก คำไม่กี่คำ เช่น "ฉันเปิดเพิ่ม URL" จะช่วยได้มาก
- รายงาน แสดงทุกสิ่งที่ถูกส่งไป อ่านก่อนได้หากต้องการ
- ส่งบน GitHub จะเปิดฟอร์ม รายงานข้อขัดข้อง ของ GitHub ในเบราว์เซอร์ของคุณ ซึ่งกรอกข้อมูลไว้แล้ว พร้อมกับโฟลเดอร์ที่เก็บรายงาน ลากไฟล์รายงานลงในฟอร์ม ตรวจสอบและส่ง คุณต้องมีบัญชี GitHub ไม่มีอะไรถูกส่งไปเอง
- หากมีคนรายงานปัญหาเดียวกันแล้ว หน้าต่างจะแจ้งให้ทราบ (รายงานแล้วว่าเป็นปัญหา #…) เปิดปัญหาที่รายงาน จะเปิดปัญหานั้นและคัดลอกรายงานของคุณไปยังคลิปบอร์ด เพื่อให้คุณสามารถเพิ่มเป็นความคิดเห็นได้
The other buttons copy the report, open its folder, or start GDM again.
รายงานประกอบด้วยอะไรบ้าง
- What happened: the error and the place in GDM's code where it happened.
- The stack: the place in GDM's code where it crashed or froze, and what every other part of it was doing.
- GDM's recent log: for example "command AddUrl" or "window opened: add-url".
- The system: GDM's version and how you installed it, your operating system and its version, the processor, the language and theme, and how many downloads and queues you have. These are counts only.
ไม่มีสิ่งเหล่านี้:
- ที่อยู่ดาวน์โหลดหรือชื่อไฟล์ของคุณ;
- ชื่อผู้ใช้ของคุณ ซึ่งแสดงเป็น
~ในเส้นทางโฟลเดอร์
หากข้อความแสดงข้อผิดพลาดอ้างอิงถึงสิ่งที่คุณพิมพ์ ข้อความนั้นจะอยู่ในรายงาน ดังนั้นควรอ่านก่อนส่ง
The crash data file (.dmp) is a snapshot of what GDM was running at that moment. It helps the developers most, but it can hold pieces of what GDM had in memory, such as download addresses, cookies and saved passwords. It is only attached when you tick Also attach the crash data.
รายงานถูกเก็บไว้ที่ไหน
In GDM's data folder:
crashes\: แต่ละรายงาน (.txt) และข้อมูลข้อขัดข้อง (.dmp);logs\: GDM's log (mdm.log, with older ones asmdm.1.logand so on, 2 MB each).
GDM's data folder is %APPDATA%\misterdownloadmanager on Windows, ~/Library/Application Support/misterdownloadmanager on macOS, and ~/.local/share/misterdownloadmanager on Linux. In portable mode it is the data folder next to the program.
The log records what GDM does, so a report can show what led to a problem. To log more detail, start GDM with the environment variable MDM_LOG=debug.
สำหรับนักพัฒนา
How it works: a second copy of GDM, the monitor, starts beside it with --crash-monitor. The crash code lives in crates/crash and crates/app/src/crash.rs.
- Catching problems. When GDM crashes (a Windows exception, a signal on Linux, a Mach exception on macOS), panics, or freezes, it asks the monitor for a dump. A freeze is a frame of the window running more than 8 s, seen by a watchdog thread that ignores time spent asleep. It times both parts of a frame: what GDM handles (the commands that come in, the clock of downloads, queues and the Scheduler), which runs minimized too, and the drawing; never the wait between frames. The watchdog also measures how much processor time the window thread got meanwhile, and the report says what that means: it ran all along (a loop), it waited in a lock or on I/O (a deadlock), or it hardly ran in ordinary code, which is a computer too busy to run GDM or slow to load it from disk, most likely not GDM's bug (those share one signature,
freeze while the computer was busy). When the window thread is already back in the event loop by the time the dump is written, the freeze was over before the snapshot, so its stack can't explain it; those reports say so and share the signaturefreeze over before the snapshot. macOS doesn't measure it yet. The monitor then writes a minidump of every thread from outside, throughminidumperandcrash-handler. A crashed process never writes its own dump, which is how Firefox, Crashpad and Sentry do it too. - การอ่านไฟล์ดัมพ์ มอนิเตอร์จะอ่านไฟล์ดัมพ์ด้วย
rust-minidumpของ Mozilla โดยจะใช้สัญลักษณ์ Breakpad ของรุ่นเมื่อพบ การสร้างจากซอร์สโค้ดสามารถอ่านข้อมูลดีบักแบบเนทีฟที่อยู่ข้างๆ ได้ด้วย (เช่น.pdb, DWARF) เมื่อสร้างด้วย--features mdm-crash/native-symbols; แอปที่จัดส่งจะไม่มีตัวอ่านนั้น ซึ่งมีขนาดหลาย MB ลายเซ็นของรายงาน (เช่นfreeze in misterdownloadmanager::winui::combo_edit) จะยังคงเหมือนเดิมสำหรับรายงานปัญหาเดียวกัน และหน้าต่างจะค้นหาปัญหาที่มีอยู่ด้วยลายเซ็นนี้ - สัญลักษณ์ บิลด์รุ่นเผยแพร่จะเก็บตารางบรรทัด (
debug = "line-tables-only") แต่ไม่มีไฟล์ดาวน์โหลดใดรวมข้อมูลดีบักไว้ CI จะแปลงข้อมูลนี้เป็นMisterDownloadManager-<version>-symbols-<platform>.zip(tools/installer/symbols.pyโดยใช้dump_symsของ Mozilla) และเผยแพร่ไว้พร้อมกับไฟล์อื่นๆ ของรุ่นนั้น หน้าต่างรายงานจะดาวน์โหลดไฟล์ zip ของรุ่นนั้นเมื่อสแต็กแสดงเฉพาะแอดเดรส .dmpจากปัญหา:
cargo run -p mdm-crash --bin mdm-symbolicate -- crash.dmp MisterDownloadManager-<version>-symbols-windows-x64.zip
- Testing it.
cargo test -p mdm-crashruns a real freeze, panic and crash (examples/crashy.rs) and checks each report's signature. To try it in the app, start GDM withMDM_CRASH_TEST=1, then runmisterdownloadmanager /show crash-test:freeze(a deadlock; orspin, 12 s of a busy window thread,panic,crash,abort).cargo test -p mdm-app --test freeze_report -- --ignoreddoes that in a copy of the app off the screens, its window visible and minimized.
ฟรี, โอเพนซอร์ส, ไม่มีโฆษณา, ไม่มีช่วงทดลองใช้
Download GolinksPRO Download Manager